
eAuditor AI Report Analysis: Turn Your Audit Data into Smart Visual Insights
AI Report Analysis — an eAuditor feature that transforms audit results into visual bar graphs, performance scores, and intelligent recommendations you can act on instantly.
Data without interpretation is just numbers — and at eAuditor, we believe your reports should talk back.
Available now in the web version of eAuditor, This enhancement marks a new era of smart reporting. The mobile version will be released soon, bringing the same AI power and visual insights right to your fingertips.
eAuditor AI Report Analysis FAQ – Frequently Asked Questions
From Raw Data to Instant Understanding
Every audit produces valuable information, but interpreting trends, compliance gaps, or improvement areas can take hours.
Now, with eAuditor’s AI Report Analysis, that work happens in seconds.

Here’s what the new feature delivers:
-
Bar Graph Visualization – Instantly see category performance, strengths, and weaknesses through clear, dynamic bar graphs.
-
Smart Scoring Engine – Automatically calculates numerical scores based on weighted responses.
-
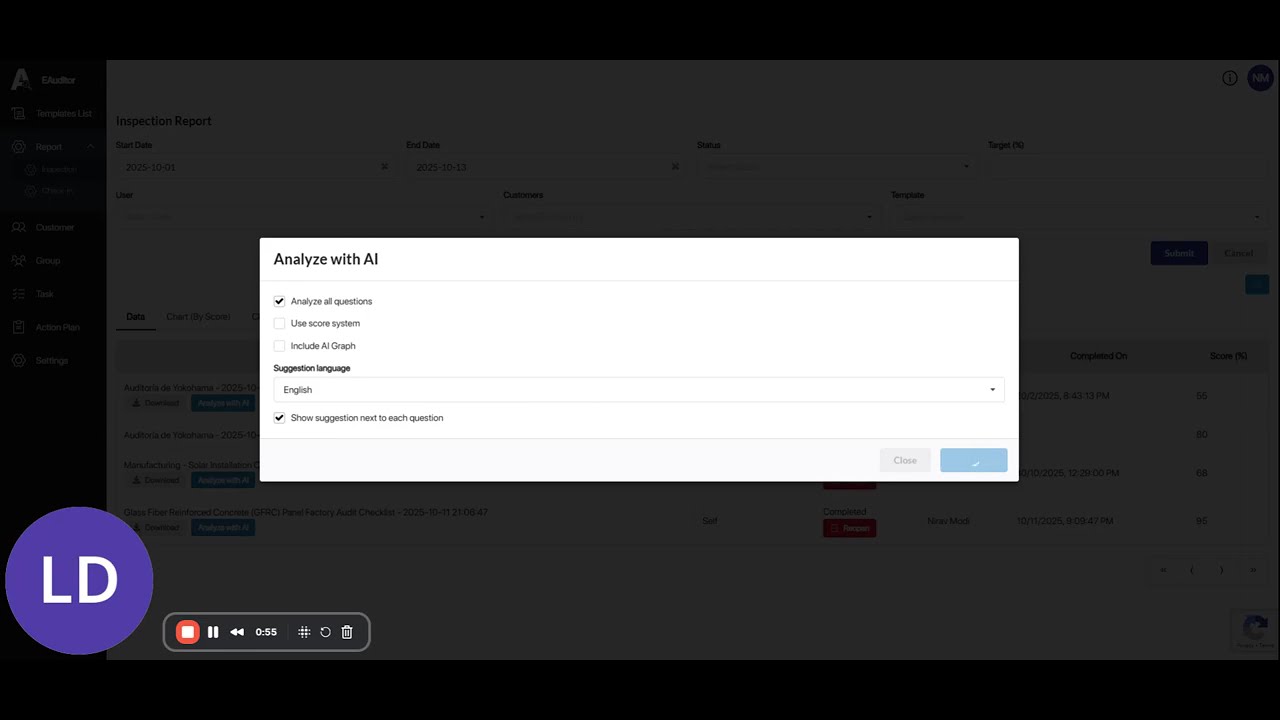
AI-Generated Suggestions – Receive contextual recommendations for corrective or preventive actions.
-
Summarized Insights – Get concise, AI-written summaries of your findings for quick management reviews.
With just one click, your audit report becomes a living dashboard that tells you what’s working — and what needs attention.
See the Bigger Picture with Bar Graphs
Bar graphs bring your reports to life.
Each bar visually represents compliance or performance across categories, helping you instantly spot trends and problem areas.
No more scrolling through spreadsheets or deciphering long tables. With one glance, you’ll know:
-
Which sites or departments are underperforming
-
Where compliance is strongest
-
How performance is changing over time
This feature is especially valuable for multi-site organizations managing safety, quality, or operational audits.
AI Suggestions That Drive Real Improvement
Beyond scores and visuals, eAuditor’s AI engine goes further — it interprets your data and provides practical next-step recommendations.
Examples include:
-
“Increase frequency of housekeeping inspections in high-traffic areas.”
-
“Review PPE compliance for operators in Zone B.”
-
“Schedule refresher safety training for night-shift employees.”
These suggestions help managers take immediate, meaningful action without needing to sift through lengthy reports.
Designed for Every Industry
From manufacturing and healthcare to hospitality, logistics, and public facilities, AI Report Analysis adapts to any workflow.
It helps teams benchmark results, strengthen CAPA processes, and make confident, data-backed decisions.

With AI Report Analysis, you can:
-
Benchmark sites and teams visually
-
Identify compliance gaps faster
-
Track performance through trend graphs
-
Present professional, AI-enhanced reports
Availability
The new AI Report Analysis with Bar Graphs and Suggestions is available now on the web version of eAuditor at https://dashboard.eauditor.app.
The mobile version will be available soon, giving field inspectors the same smart insights wherever they work.
Sample eAuditor AI Report Analysis PDF
The Future of Auditing Is Intelligent
At eAuditor, we’re redefining what it means to audit intelligently.
With AI-driven visuals, scores, and contextual suggestions, your reports now provide not just data — but direction.
Start using the new AI Report Analysis today and turn your inspections into insights that inspire improvement.
👉 Log in to eAuditor to explore the future of smart auditing.